
Home CoffeeRoaster Support
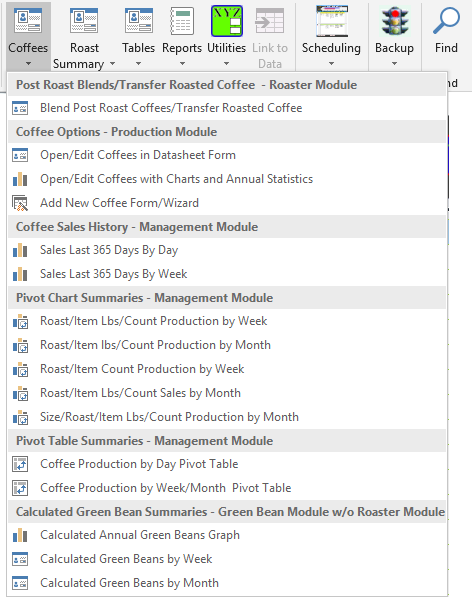
| Navigation - Coffee Icon | |
 |
|
| |
This menu item is used primarily by the Roaster to create a Log file for Post Roast Blends. |
| Coffee Options | |
|
|
Coffee items can be edited directly in this datasheet form, each Coffee represents a Row in the datasheet. All the fields necessary to configure a Coffee are available. |
|
|
This item opens a Chart with monthly summary statistics on lbs of Coffee produced for the selected year. Multiple chart views are available. This Graph is also viewable from other CoffeeRoaster Modules. |
|
|
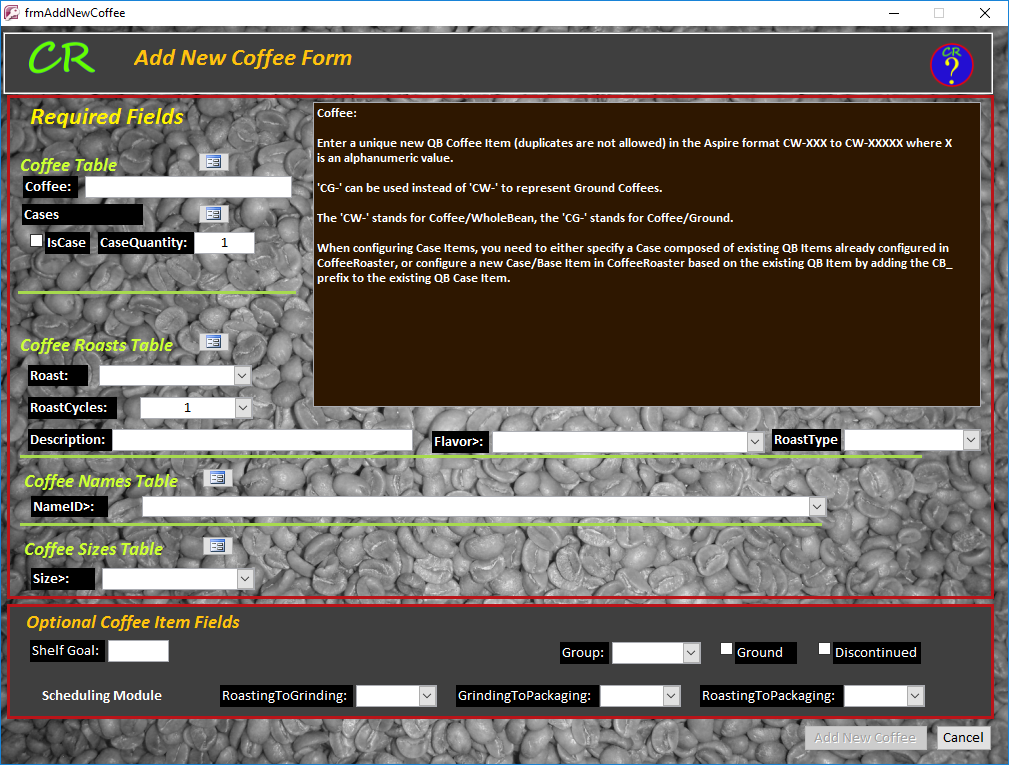
This is the quickest way to enter a new Coffee. A new coffee cannot be entered until the data that it is dependent on has been entered in the Size table, Name Table and an Roast has been defined. These fields will then be selectable through drop down menus. If connecting to an external database such as QuickBooks make sure that the Coffee field exactly matches the Item field in QuickBooks. |
 |
|
| Coffee Sales History | |
|
|
This Chart shows either a composite of all Coffees sold during the last 365 days or the graph can be filtered to select a specific Coffee of your choice. The intent of this graph is to assist with setting Shelf Goals. |
|
|
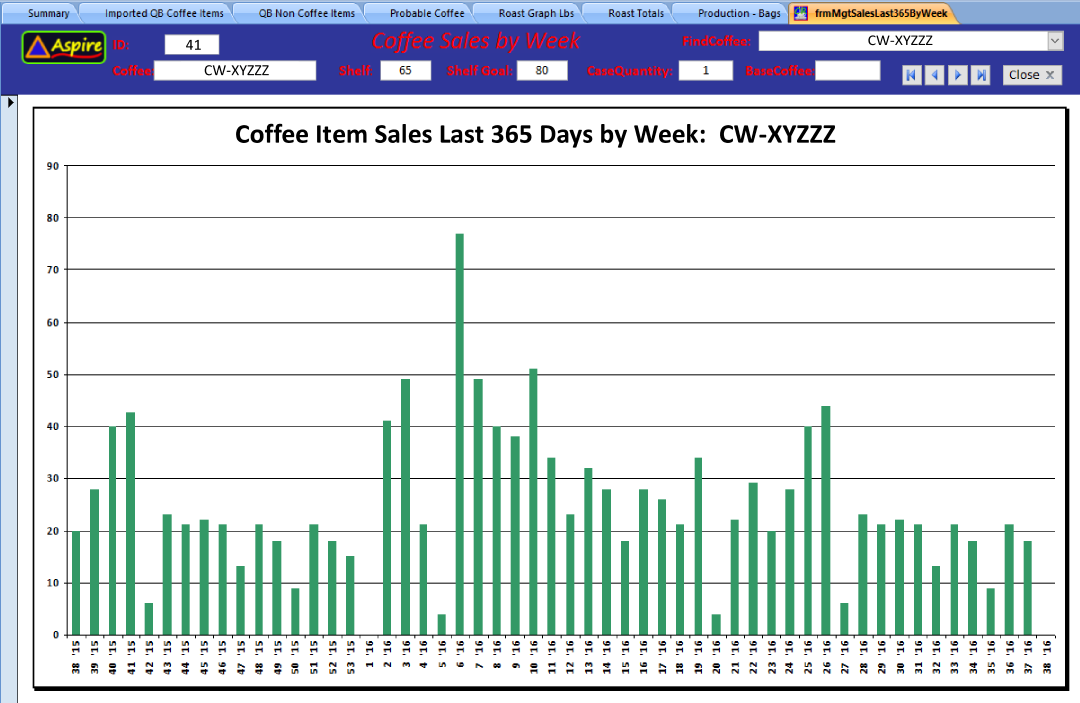
This Chart is similar to the chart above except that it sums the Coffee items by week. As you can view the Sales history of that specific coffee over the last 365 days this is a good indicator of what future sales will be and is designed to be used in setting Shelf Goals. When the Chart first opens it will display results for all Coffees, then you filter the graph by the desired Coffee. An example of the graph is shown below. |
 |
|
| Pivot Chart Summaries | |
|
|
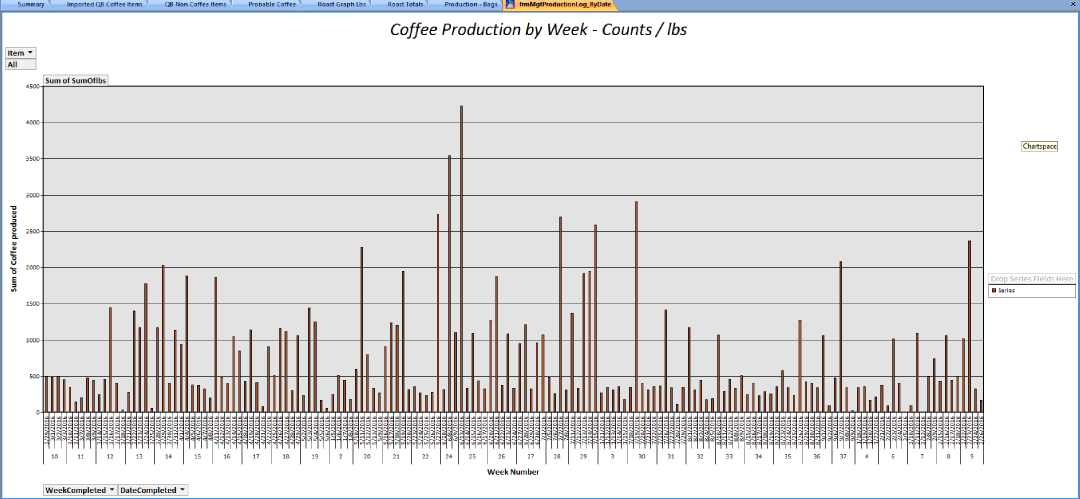
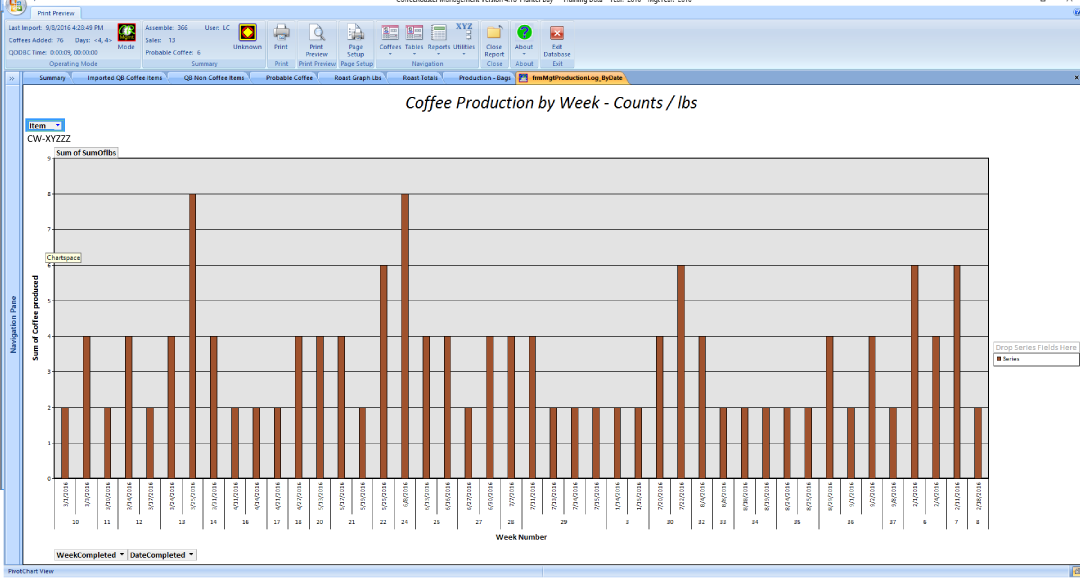
This item is a Microsoft Pivot Chart displaying Coffee Production by week in Lbs. The Chart will show either All Coffees or you can specify filtering options in the controls in the upper left hand column. An example of this Pivot Chart is shown below. The graph below is showing the totals for all coffees. The second Chart shows the Coffee Production filtered by a specific Coffee selected by using the Item control in the upper left hand corner of the Pivot Chart. |
  |
|
|
|
This pivot Chart is similar to the one above except that it shows Lbs by Month. |
|
|
This pivot Chart is similar to the one above except that it shows Lbs by Week. |
|
|
This pivot Chart is similar to the one above except that it shows Coffee Counts by Month. |
|
|
This pivot Chart is similar to the one above except that is shows Coffee Lbs by packaging Size. |
| Pivot Table Summaries | |
|
|
This item is a Microsoft Pivot Table that summarizes Coffee Production Data for Roasts by Coffee in Counts and Lbs. The data is organized by Day. |
|
|
This item is a Microsoft Pivot Table that summarizes Coffee Production Data for Roasts by Coffee in Counts and Lbs. The data is organized by Month. |
| Calculated Green Bean Summaries | |
|
|
This item shows an estimation of Green Bean use in lbs for the year based on production data and estimated shrinkages. The data is used by CoffeeRoaster customers who want to estimate their Green Bean usage by estimating Green Bean usage from Bagging entries rather than by the preferred method of Direct Deduction used by the CoffeeRoaster Roast Module. This data is only of value to those who have the Green Bean Module but not the Roast Module. |
|
|
The same as above except with data represented in a Form rather than as a graph. Data is organized by Week. |
|
|
The same as above except with data represented in a Form rather than as a graph. Data is organized by Month. |