
Home CoffeeRoaster Support
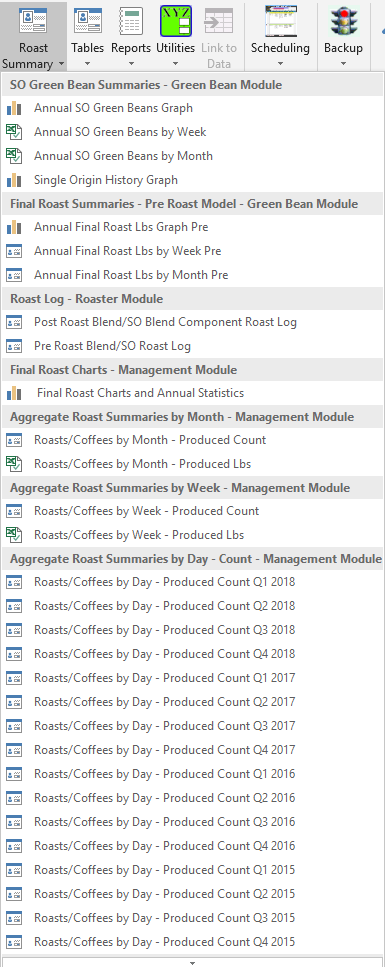
| Navigation - Roast Summary Icon | |
 |
|
| |
This graph shows Single Origin use in Lbs for the specified year and applies to both Pre and Post Roast Blend Models. |
| |
This form shows Single Origin use in Lbs for each Week of the specified year and applies to both Pre and Post Roast Blend Models. |
| |
This form shows Single Origin use in Lbs for each Month of the specified year and applies to both Pre and Post Roast Blend Models. |
| Final Roast Summaries | |
|
|
This graph/chart shows annual totals for Roasts, the final product that goes into bagging. The graph is for Pre Roast Blend Data. |
|
|
This form shows annual totals for Roasts, either Pre Roast Blends or Single Origins roasted for direct packaging in the Prer Roast Blend Model. Data is organized by Week. |
|
|
This form shows annual totals for Roasts, either Pre Roast Blends or Single Origins roasted for direct packaging in the Prer Roast Blend Model. Data is organized by Week. |
| Roast Log | |
|
|
Opens the Post Roast Blend Roast Log Form showing Roasts for the last 90 days with the option of showing all Roasts. For the Post Roast Blend Model these are Roast Components that are roasted to be used in blending Post Roast Blend coffees. If your Roastery does not use the Pre Roast Blend Model for Single Origins that go directly to packaging as Single Origins, then this Single Origin data should be configured and stored in this roast log so that all your Roast Log data is in one place. If your Roast Model includes both Pre Roast Blends and Post Roast Blends, then this log should only be used for Post Roast Blend coffees roasted to blend as Post Roast Blends and the Single Origins roasted to go directly to packaging should be configured and managed in the Pre Roast Blend Log. |
|
|
Opens the Pre Roast Blend Roast Log form showing Roasts for the last 90 days with the option of showing all Roasts. The Pre Roast Blend Model and Roast Log should be used for all Pre Roast Blends and include all Single Origins that go directly to packaging rather than used as Post Roast Blend components. |
| Final Roast Charts | |
|
|
This is a graph similar to the Coffee Summary Graph except that all data for a given 'Final Roast' rather than an individual Coffee Item is displayed for the year. It takes a minute to compute this information but this graph displays important information regarding both Sales and Production History (Sales is in Green on the graph, Production is in Brick Red). This annual summary of Coffee Roast information is exclusive to the Management Module. An example of this graph is shown below. |
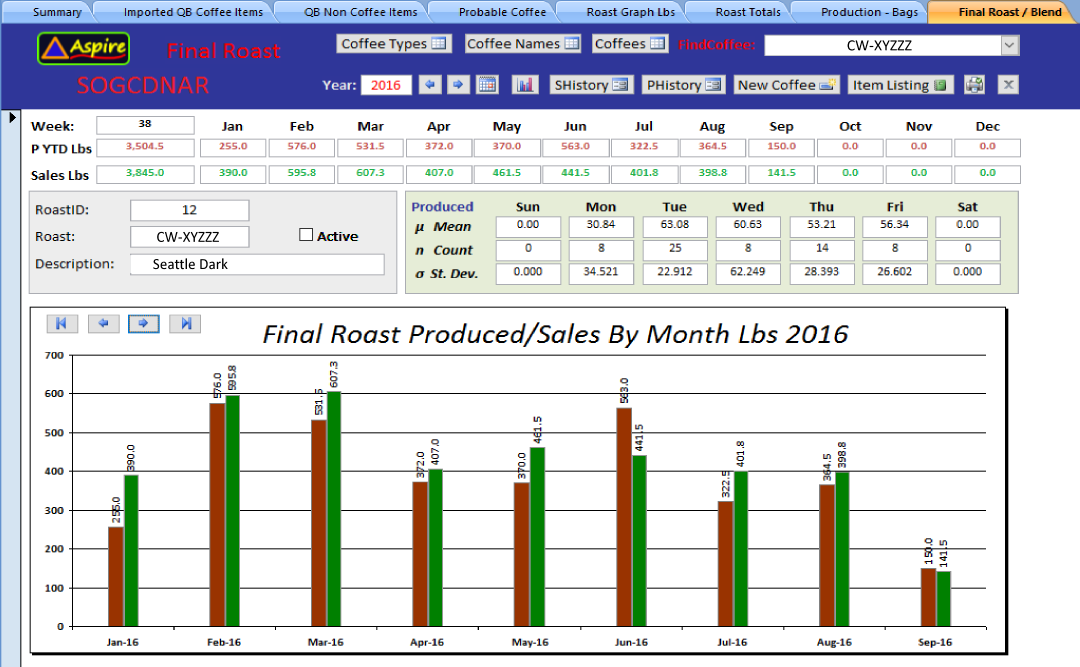 |
|
| Aggregate Roast Summaries by Month | |
|
|
This form summarizes Production data in bag count totals by Roast, Coffee and by Month for the specified year. |
|
|
This form is similar to the form above except that the units are in lbs. The form summarizes Production data in lbs by Roast, Coffee and by Month for the specified year. |
| Aggregate Roast Summaries by Week | |
|
|
This form summarizes Production data in bag count totals by Roast, Coffee and by Week for the speciied year. |
| |
This form is similar to the form above except that the units are in lbs. The form summarizes Production data in lbs by Roast, Coffee and by Week for the specified year. |
| Aggregate Roast Summaries by Day – Count | |
| |
This is the first of a series of 12 Forms representing Produced Coffee counts by Day. Each form summarizes production for 1st Qtr, 2nd Qtr, 3rd Qtr or 4th Qtr for a given year. Data is summarized by Roast, by Coffee Item and production bag totals for each day of the specified Quarter. The first Graph represents the first quarter of the current year. |
| |
Same as above, this graph represents the second quarter of the current year. |
| |
Same as above, this graph represents the third quarter of the current year. |
| |
Same as above, this graph represents the fourth quarter of the current year. |
| |
Same as above, this graph represents the first quarter of the previous year. |
| |
Same as above, this graph represents the second quarter of the previous year. |
| |
Same as above, this graph represents the third quarter of the previous year. |
| |
Same as above, this graph represents the fourth quarter of the previous year. |
| |
Same as above, this graph represents the first quarter going back 2 years from the current year. |
| |
Same as above, this graph represents the second quarter going back 2 years from the current year. |
| |
Same as above, this graph represents the third quarter going back 2 years from the current year. |
| |
Same as above, this graph represents the fourth quarter going back 2 years from the current year. |
| Aggregate Roast Summaries by Day – Lbs | |
| |
This is the first of a series of 12 Forms representing Produced Coffee Lbs by Day. Each form summarizes production for 1st Qtr, 2nd Qtr, 3rd Qtr or 4th Qtr for a given year. Data is summarized by Roast, by Coffee Item and production lbs totals for each day of the specified Quarter. The first Graph represents the first quarter of the current year. |
| |
Same as above, this graph represents the second quarter of the current year. |
| |
Same as above, this graph represents the Third quarter of the current year. |
| |
Same as above, this graph represents the fourth quarter of the current year. |
| |
Same as above, this graph represents the first quarter of the previous year. |
| |
Same as above, this graph represents the second quarter of the previous year. |
| |
Same as above, this graph represents the third quarter of the previous year. |
| |
Same as above, this graph represents the fourth quarter of the previous year. |
| |
Same as above, this graph represents the first quarter going back 2 years from the current year. |
| |
Same as above, this graph represents the second quarter going back 2 years from the current year. |
| |
Same as above, this graph represents the third quarter going back 2 years from the current year. |
| |
Same as above, this graph represents the fourth quarter going back 2 years from the current year. |